There are no items in your cart
Add More
Add More
| Item Details | Price | ||
|---|---|---|---|

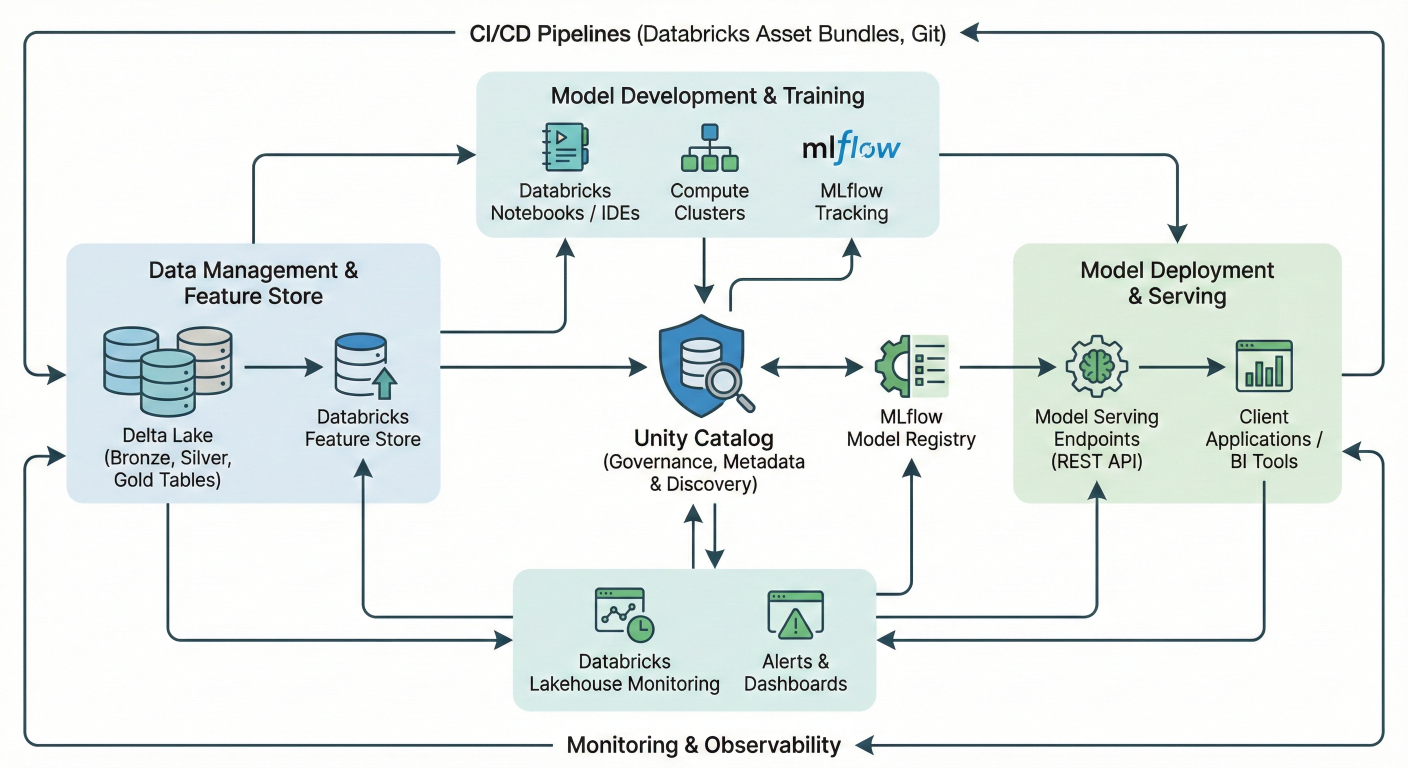
Comprehensive MLOps architecture diagram showing Databricks ecosystem: Unity Catalog at center, connected to MLflow Model Registry, Delta Lake, Feature Store, Model Serving endpoints, CI/CD pipelines, and monitoring tools. Include data flow arrows and component relationships.
Databricks transforms the complex world of machine learning operations (MLOps) into a streamlined, unified platform that eliminates the traditional headaches of managing fragmented ML tools. If you're tired of stitching together different systems for data prep, model training, deployment, and monitoring, you're in the right place
MLOps combines the best practices from DevOps, DataOps, and ModelOps to create reliable, scalable machine learning systems that actually deliver business value. With Databricks, you get an end-to-end solution that handles everything from raw data ingestion to production model monitoring on a single platform.
Traditional ML pipelines often suffer from data silos and tool fragmentation. Data scientists work in one environment, data engineers in another, and ML engineers struggle to deploy models that were built in completely different systems.
Databricks solves this with its Lakehouse architecture, which unifies all your data and AI assets in one place. This means:
What sets Databricks apart is its commitment to open-source technologies. Instead of locking you into proprietary formats, it builds on industry standards like:
MLflow for model lifecycle management
Delta Lake for reliable data storage with ACID transactions
Apache Spark for distributed processing
Standard CI/CD tools like GitHub Actions and Azure DevOps
This approach gives you flexibility while maintaining enterprise-grade reliability.
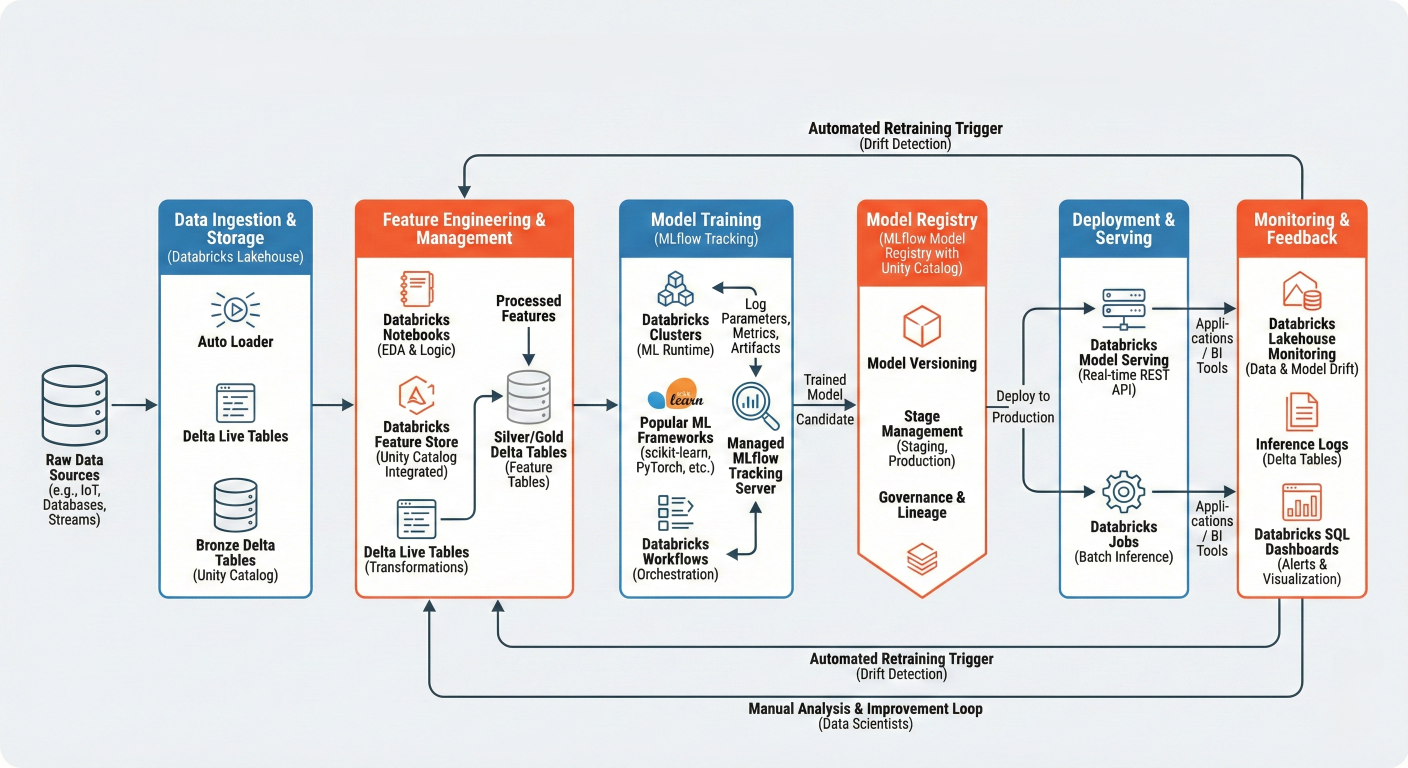
Detailed workflow diagram showing: Raw Data → Feature Engineering → Model Training (MLϐlow tracking) → Model Registry → Deployment → Monitoring, with feedback loops. Include speciϐic Databricks components at each stage.
Everything starts with solid data foundations. Delta Lake provides versioned, reliable storage that prevents the "bad data creeping into models" problem that plagues many ML projects.
For feature engineering, Databricks offers multiple approaches:
import databricks.automl as db_automl
# AutoML handles feature engineering automatically
summary = db_automl.classify(
 dataset=training_df,
 target_col="target",
 primary_metric="f1",
 timeout_minutes=30
)
The AutoML toolkit automatically handles missing value imputation, categorical encoding, and feature normalization. It even detects semantic types and applies appropriate preprocessing based on your data characteristics.
from pyspark.sql import functions as F
from pyspark.ml.feature import VectorAssembler, StandardScaler

# Feature engineering pipeline
def create_features(df):
    # Handle missing values
    df_clean = df.fillna({
        'numeric_col': df.agg(F.mean('numeric_col')).collect(),
        'categorical_col': 'unknown'
    })

    # Create interaction features
    df_features = df_clean.withColumn(
        'interaction_feature',
        F.col('feature1') * F.col('feature2')
    )MLflow integration in Databricks eliminates the nightmare of tracking experiments across spreadsheets. Every model training run automatically logs parameters, metrics, and artifacts.[6]

    # Assemble feature vectors
    assembler = VectorAssembler(
        inputCols=['feature1', 'feature2', 'interaction_feature'],
        outputCol='features'
    )

    return assembler.transform(df_features)
Lorem Ipsum is simply dummy text of the printing and typesetting industry. Lorem Ipsum has been the industry's standard dummy text ever since the 1500s, when an unknown printer took a galley of type and scrambled it to make a type specimen book.
import mlflow
import mlflow.sklearn
from sklearn.ensemble import RandomForestClassifier
from sklearn.metrics import accuracy_score, f1_score

# MLflow automatically tracks experiments in Databricks
with mlflow.start_run() as run:
    # Log parameters
    mlflow.log_param("n_estimators", 100)
    mlflow.log_param("max_depth", 10)

    # Train model
    rf = RandomForestClassifier(n_estimators=100, max_depth=10)
    rf.fit(X_train, y_train)

    # Make predictions and log metrics
    predictions = rf.predict(X_test)
    accuracy = accuracy_score(y_test, predictions)
    f1 = f1_score(y_test, predictions, average='weighted')

    mlflow.log_metric("accuracy", accuracy)
    mlflow.log_metric("f1_score", f1)

    # Log the model
    mlflow.sklearn.log_model(rf, "random_forest_model")

    print(f"Run ID: {run.info.run_id}")
    print(f"Accuracy: {accuracy:.3f}")
    print(f"F1 Score: {f1:.3f}")
The beauty of this approach is that you get automatic lineage tracking. When you register a model to Unity Catalog, it maintains connections back to the data, features, and experiments that created it.[7][8]
Unity Catalog transforms model management from a manual process into a governed, enterprise-ready system. Models registered in Unity Catalog follow a three-level namespace:
<catalog>.<schema>.<model_name>.
Lorem Ipsum is simply dummy text of the printing and typesetting industry. Lorem Ipsum has been the industry's standard dummy text ever since the 1500s, when an unknown printer took a galley of type and scrambled it to make a type specimen book.
This approach provides several key benefits:
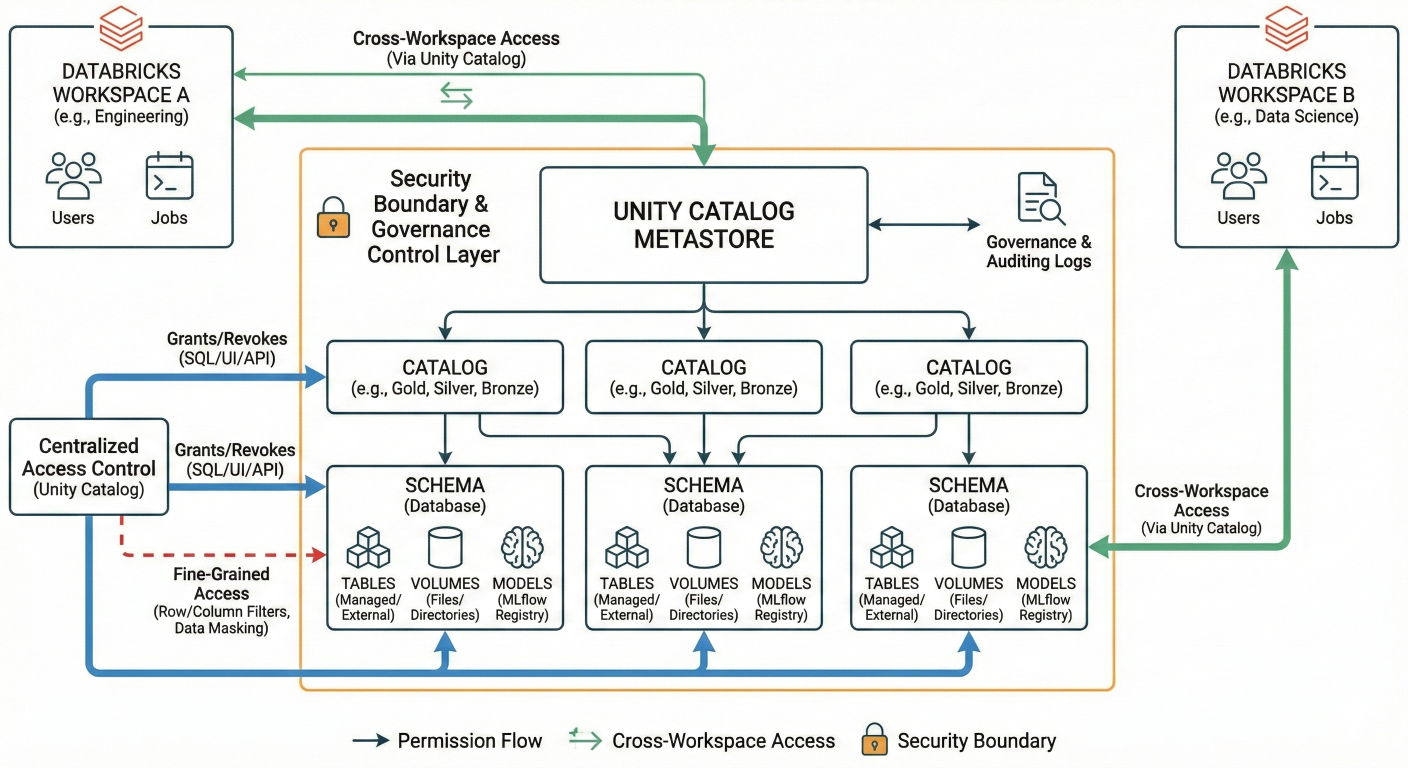
Architecture diagram showing Unity Catalog structure: Catalogs → Schemas → Models, Tables, Volumes. Show permission flows and cross-workspace access patterns. Include security boundaries and governance controls.
Manual model deployment is a recipe for inconsistency and errors. Databricks integrates seamlessly with CI/CD tools to automate your entire deployment pipeline.
Here's a complete GitHub Actions workflow for automated model deployment:
name: MLOps Pipeline
on:
  push:
    branches: [main]
  pull_request:
    branches: [main]

jobs:
  test:
    runs-on: ubuntu-latest
    steps:
      - uses: actions/checkout@v3

      - name: Set up Python
        uses: actions/setup-python@v4
        with:
          python-version: '3.9'

      - name: Install dependencies
        run: |
          pip install databricks-cli mlflow

      - name: Run unit tests
        run: |
          pytest tests/

      - name: Validate model quality
        env:
          DATABRICKS_HOST: ${{ secrets.DATABRICKS_HOST }}
          DATABRICKS_TOKEN: ${{ secrets.DATABRICKS_TOKEN }}
        run: |
          python scripts/validate_model.py

  deploy:
    needs: test
    if: github.ref == 'refs/heads/main'
    runs-on: ubuntu-latest
    steps:
      - uses: actions/checkout@v3

      - name: Deploy to Databricks
        env:
          DATABRICKS_HOST: ${{ secrets.DATABRICKS_HOST }}
          DATABRICKS_TOKEN: ${{ secrets.DATABRICKS_TOKEN }}
        run: |
          # Deploy model to staging
          python scripts/deploy_model.py --env staging

          # Run integration tests
          python scripts/integration_tests.py --env staging

          # Promote to production if tests pass
          python scripts/promote_to_production.py
Once your model passes all tests, Databricks Model Serving makes deployment effortless. Models become REST API endpoints that automatically scale based on demand.[
# Deploy model as REST endpoint
from databricks.model_serving import ModelServingClient

client = ModelServingClient()

# Create serving endpoint
endpoint_config = {
    "name": "customer-churn-endpoint",
    "config": {
        "served_models": [{
            "model_name": "production.ml_models.customer_churn_classifier",
            "model_version": "1",
            "workload_size": "Small",
            "scale_to_zero_enabled": True
        }]
    }
}

client.create_serving_endpoint(endpoint_config)
import requests
import json

# Prepare prediction data
data = {
    "dataframe_records": [
        {
            "feature1": 0.5,
            "feature2": 1.2,
            "feature3": "category_a"
        }
    ]
}

# Make prediction request
response = requests.post(
    f"{databricks_host}/serving-endpoints/customer-churn-endpoint/invocations",
    headers={
        "Authorization": f"Bearer {token}",
        "Content-Type": "application/json"
    },
    data=json.dumps(data)
)

predictions = response.json()
print(f"Churn probability: {predictions['predictions']}")
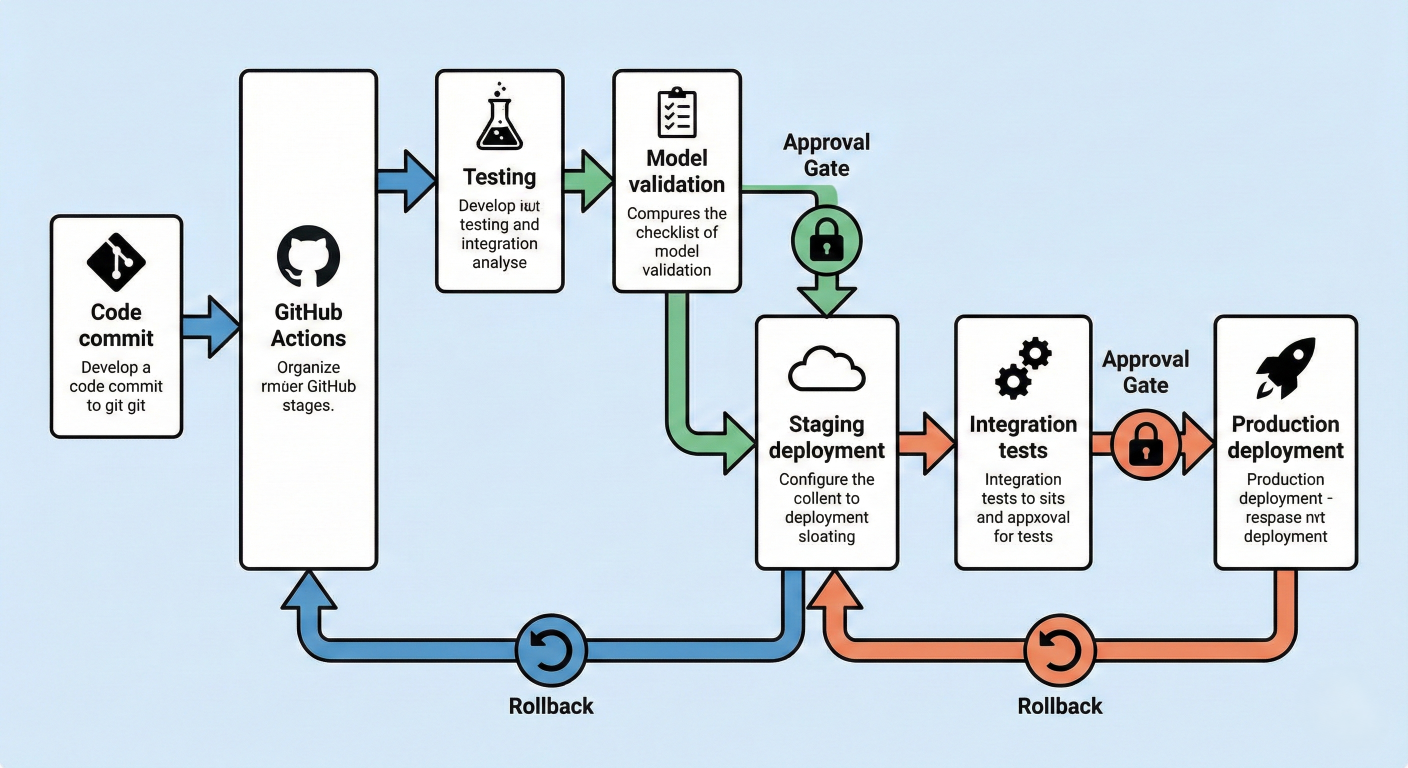
Deployment pipeline diagram showing: Code commit → GitHub Actions → Testing → Model validation → Staging deployment → Integration tests → Production deployment. Include rollback mechanisms and approval gates.
Production models degrade over time due to data drift, concept drift, and changing business conditions. Databricks provides comprehensive monitoring capabilities to catch these issues early.
# Set up monitoring for deployed model
from databricks.model_monitoring import ModelMonitor

monitor = ModelMonitor(
    model_name="production.ml_models.customer_churn_classifier",
    endpoint_name="customer-churn-endpoint"
)

# Configure drift detection
monitor.enable_drift_detection(
    baseline_table="production.monitoring.baseline_data",
    comparison_window_hours=24,
    drift_threshold=0.1
)

# Set up alerting
monitor.add_alert(
    alert_type="drift",
    threshold=0.15,
    notification_channels=["#ml-alerts", "ml-team@company.com"]
)
Create monitoring dashboards to track key metrics:
# Create performance tracking table
from pyspark.sql import functions as F

def log_model_performance(predictions_df, actuals_df):
    """Log model performance metrics to Delta table"""

    # Join predictions with actual outcomes
    performance_df = predictions_df.alias("pred").join(
        actuals_df.alias("actual"),
        on="customer_id"
    ).withColumn("prediction_date", F.current_timestamp())

    # Calculate accuracy
    accuracy_df = performance_df.withColumn(
        "correct_prediction",
        F.when(F.col("pred.prediction") == F.col("actual.churn"), 1).otherwise(0)
    ).groupBy("prediction_date").agg(
        F.avg("correct_prediction").alias("accuracy"),
        F.count("*").alias("total_predictions")
    )

    # Write to monitoring table
 accuracy_df.write.mode("append").saveAsTable("production.monitoring.model_performance")

# Set up automated retraining trigger
def check_performance_threshold():
    latest_accuracy = spark.sql("""
        SELECT accuracy
        FROM production.monitoring.model_performance
        ORDER BY prediction_date DESC
        LIMIT 1
    """).collect()['accuracy']

    if latest_accuracy < 0.85:
        trigger_model_retraining()

def trigger_model_retraining():
    """Trigger automated model retraining pipeline"""
    import requests

    # Trigger Databricks workflow
    response = requests.post(
        f"{databricks_host}/api/2.1/jobs/run-now",
        headers={"Authorization": f"Bearer {token}"},
        json={"job_id": "retraining_job_id"}
    )

    print("Model retraining triggered due to performance degradation")
The Databricks Feature Store eliminates the train-serve skew problem by ensuring features used in training exactly match those used in production.
from databricks.feature_store import FeatureStoreClient
fs = FeatureStoreClient()

# Create feature table
def create_customer_features():
    """Create and register customer features"""

    # Calculate customer features
    customer_features = spark.sql("""
        SELECT
            customer_id,
            AVG(purchase_amount) as avg_purchase_amount,
            COUNT(*) as total_purchases,
            DATEDIFF(CURRENT_DATE(), MAX(purchase_date)) as days_since_last_purchase,
            CURRENT_TIMESTAMP() as feature_timestamp
        FROM production.raw.transactions
        WHERE purchase_date >= CURRENT_DATE() - INTERVAL 90 DAYS
        GROUP BY customer_id
    """)

    # Create feature table
    fs.create_table(
        name="production.features.customer_features",
        primary_keys=["customer_id"],
        df=customer_features,
        description="Customer behavioral features for churn prediction"
    )

# Use features in training
def train_with_feature_store():
    """Train model using Feature Store features"""

    # Create training set with automatic feature lookup
    training_set = fs.create_training_set(
        df=spark.table("production.labels.customer_labels"),
        feature_lookups=[
            fs.FeatureLookup(
                table_name="production.features.customer_features",
                lookup_key="customer_id"
            )
        ],
        label="churn",
        exclude_columns=["feature_timestamp"]
    )

    training_df = training_set.load_df()

    # Train model with MLflow tracking
    with mlflow.start_run() as run:
        # Model training code here
        model = train_model(training_df)

        # Log model with feature store metadata
        fs.log_model(
            model=model,
            artifact_path="model",
            flavor=mlflow.sklearn,
            training_set=training_set,
            registered_model_name="production.ml_models.customer_churn_classifier"
        )
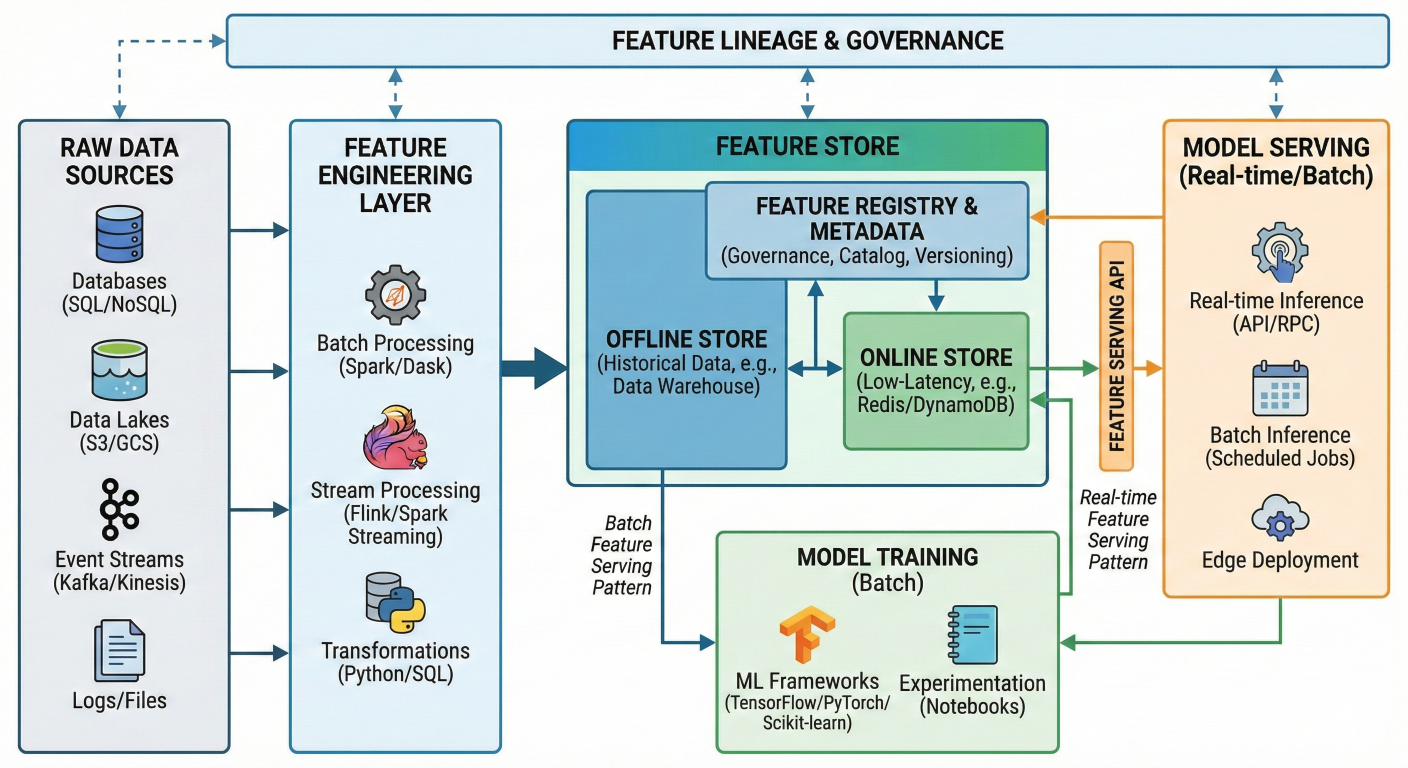
Feature Store architecture diagram showing: Raw data → Feature engineering → Feature Store → Model training AND Model serving. Show feature lineage and governance. Include real-time and batch feature serving patterns.
Multi-Environment Model Management
Production MLOps requires proper environment separation. Here's how to set up dev, staging, and production environments:
class MLOpsEnvironment:
    """Manage models across different environments"""

    def __init__(self, env_name):
        self.env = env_name
        self.catalog = f"{env_name}_catalog"
        self.model_schema = "ml_models"

    def get_model_name(self, base_name):
        return f"{self.catalog}.{self.model_schema}.{base_name}"

    def promote_model(self, model_name, from_env, to_env):
        """Promote model between environments"""

        from_model = f"{from_env}_catalog.ml_models.{model_name}"
        to_model = f"{to_env}_catalog.ml_models.{model_name}"

        # Copy model artifacts
        client = MlflowClient()

        # Get latest version from source environment
        latest_version = client.get_latest_versions(
            from_model,
            stages=["Production"]
        )

        # Register in target environment
        model_uri = f"models:/{from_model}/{latest_version.version}"
        mlflow.register_model(model_uri, to_model)

        print(f"Promoted {model_name} from {from_env} to {to_env}")

# Usage
dev_env = MLOpsEnvironment("dev")
staging_env = MLOpsEnvironment("staging")
prod_env = MLOpsEnvironment("prod")

# Promote from dev to staging
dev_env.promote_model("customer_churn_classifier", "dev", "staging") class ModelABTesting:
"""Framework for A/B testing models in production"""
def __init__(self, endpoint_name):
self.endpoint_name = endpoint_name
def setup_ab_test(self, champion_model, challenger_model, traffic_split=0.1):
"""Set up A/B test between two models"""
config = {
"served_models": [
{
"model_name": champion_model,
"model_version": "latest",
"workload_size": "Small",
"traffic_percentage": int((1 - traffic_split) * 100)
},
{
"model_name": challenger_model,
"model_version": "latest",
"workload_size": "Small",
"traffic_percentage": int(traffic_split * 100)
}
]
}
# Update endpoint configuration
client = ModelServingClient()
client.update_serving_endpoint(self.endpoint_name, config)
print(f"A/B test configured: {traffic_split*100}% traffic to challenger")
def analyze_ab_results(self, test_duration_hours=24):
"""Analyze A/B test results"""
results = spark.sql(f"""
SELECT
model_version,
COUNT(*) as requests,
AVG(prediction_score) as avg_score,
AVG(response_time_ms) as avg_latency
FROM production.monitoring.endpoint_logs
WHERE endpoint_name = '{self.endpoint_name}'
AND request_timestamp >= CURRENT_TIMESTAMP() - INTERVAL {test_duration_hours} HOURS
GROUP BY model_version
""")
return results.display()
# Set up A/B test
ab_test = ModelABTesting("customer-churn-endpoint")
ab_test.setup_ab_test(
champion_model="production.ml_models.customer_churn_v1",
challenger_model="production.ml_models.customer_churn_v2",
traffic_split=0.2
)
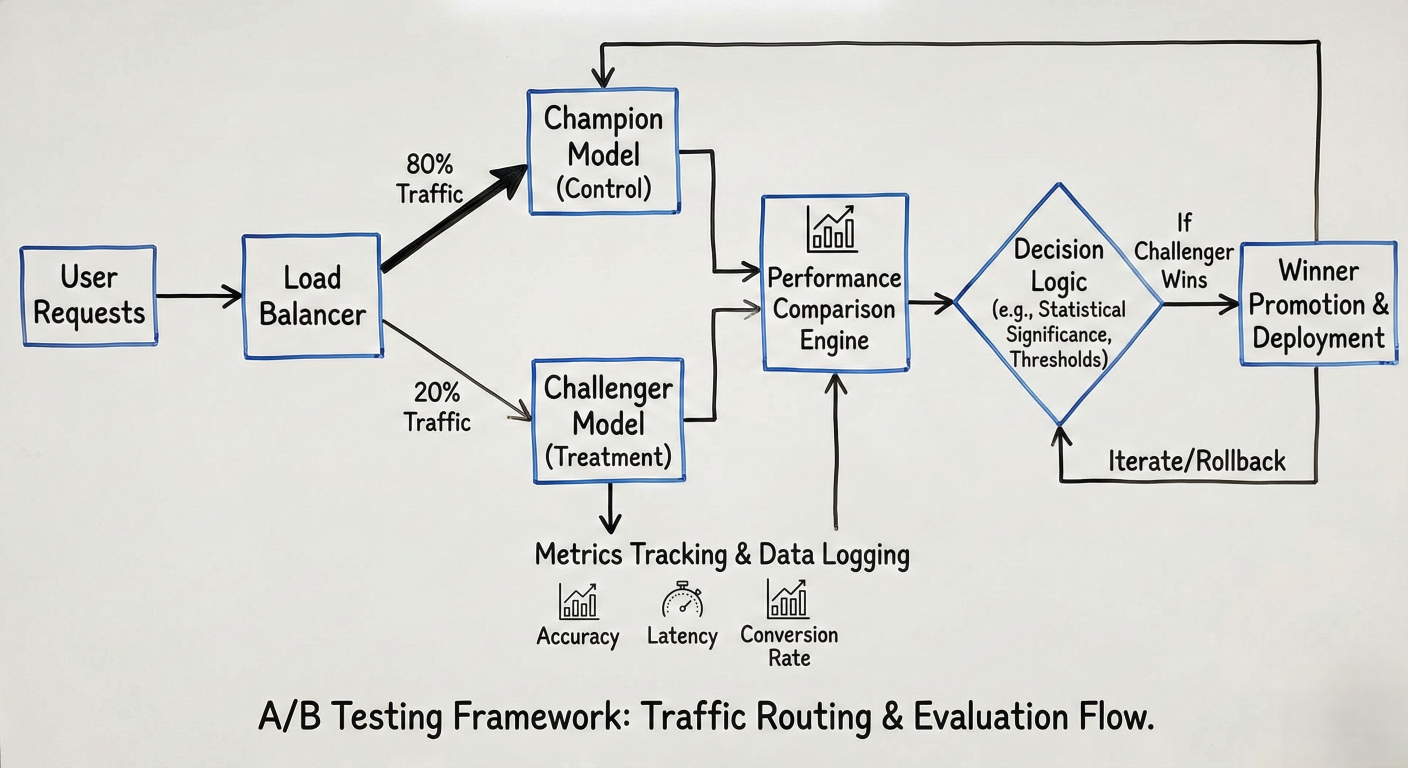 A/B testing diagram showing traffic routing: User requests → Load balancer → Champion model (80%) and Challenger model (20%) → Performance comparison → Winner promotion. Include metrics tracking and decision logic.
# Model validation tests
def validate_model_quality(model_uri, test_data):
    """Comprehensive model validation"""

    model = mlflow.sklearn.load_model(model_uri)
    predictions = model.predict(test_data)

    # Basic performance tests
    accuracy = accuracy_score(test_data['label'], predictions)
    assert accuracy > 0.8, f"Model accuracy {accuracy} below threshold"

    # Fairness tests
    for group in test_data['sensitive_attribute'].unique():
        group_mask = test_data['sensitive_attribute'] == group
        group_accuracy = accuracy_score(
            test_data[group_mask]['label'],
            predictions[group_mask]
        )
        assert group_accuracy > 0.75, f"Unfair performance for group {group}"

    # Data drift tests
    feature_stats = test_data.describe()
    # Compare with training baseline
    for col in feature_stats.columns:
        if abs(feature_stats[col]['mean'] - training_baseline[col]['mean']) > 2:
            raise ValueError(f"Significant drift detected in {col}")

    print("All model validation test passed")
Use Databricks Workflows to orchestrate your entire MLOps pipeline:
# Workflow definition for automated MLOps
workflow_config = {
 "name": "customer_churn_mlops_pipeline",
 "tasks": [
   {
     "task_key": "data_quality_check",
     "notebook_task": {
       "notebook_path": "/notebooks/data_quality_validation"
     }
   },
   {
     "task_key": "feature_engineering",
     "depends_on": [{"task_key": "data_quality_check"}],
     "notebook_task": {
       "notebook_path": "/notebooks/feature_engineering"
     }
   },
   {
     "task_key": "model_training",
     "depends_on": [{"task_key": "feature_engineering"}],
     "notebook_task": {
       "notebook_path": "/notebooks/model_training"
     }
   },
   {
     "task_key": "model_validation",
     "depends_on": [{"task_key": "model_training"}],
     "notebook_task": {
       "notebook_path": "/notebooks/model_validation"
     }
   },
   {
     "task_key": "model_deployment",
     "depends_on": [{"task_key": "model_validation"}],
     "notebook_task": {
       "notebook_path": "/notebooks/model_deployment"
     }
   }
 ],
 "schedule": {
   "cron_expression": "0 2 * * 1" # Weekly on Monday at 2 AM
 }
}
# Model governance policies
class ModelGovernance:
    """Enforce model governance policies"""

    @staticmethod
    def require_approval_for_production(model_name, version):
        """Require manual approval for production deployment"""

        # Check if model has required metadata
        model_info = mlflow.get_model_version(model_name, version)

        required_tags = ['data_source', 'training_date', 'performance_metrics']
        for tag in required_tags:
            if tag not model_info.tags:
                raise ValueError(f"Missing required tag: {tag}")

        # Require approval workflow
        approval_status = get_approval_status(model_name, version)
        if approval_status != "approved":
            raise ValueError("Model requires approval before production deployment")

    @staticmethod
    def enforce_retention_policy(catalog, days_to_retain=90):
        """Clean up old model versions"""

        client = MlflowClient()
        cutoff_date = datetime.now() - timedelta(days=days_to_retain)

        for model in client.list_registered_models():
            if model.name.startswith(catalog):
                versions = client.get_model_version_by_stage(model.name, "Archived")

                for version in versions:
                    if version.creation_timestamp < cutoff_date.timestamp() * 1000:
                        client.delete_model_version(model.name, version.version)
                        print(f"Deleted old version {version.version} of {model.name}")
Problem: Inconsistent data quality between training and production environments.
Solution: Implement automated data validation:
from pyspark.sql import functions as F

def validate_data_quality(df, table_name):
    """Comprehensive data quality validation"""

    # Check for null values
    null_counts = df.select([
        F.count(F.when(F.col(c).isNull(), c)).alias(c)
        for c in df.columns
    ]).collect()

    for col, null_count in null_counts.asDict().items():
        null_pct = null_count / df.count()
        if null_pct > 0.1:  # More than 10% nulls
            raise ValueError(f"High null percentage in {col}: {null_pct:.2%}")

    # Check for data drift
    current_stats = df.describe()
    baseline_stats = spark.table(f"monitoring.baseline_stats_{table_name}")

    for col in current_stats.columns:
        if col in baseline_stats.columns:
            current_mean = current_stats.filter(F.col("summary") == "mean").select(col).collect()
            baseline_mean = baseline_stats.filter(F.col("summary") == "mean").select(col).collect()

            if abs(float(current_mean) - float(baseline_mean)) / float(baseline_mean) > 0.2:
                print(f"Warning: Significant drift in {col}")

    print(f"Data quality validation passed for {table_name}")
Problem: Models lose accuracy over time but issues aren't detected quickly enough.
Solution: Implement real-time monitoring with automated alerts:
# Real-time performance monitoring
def monitor_model_performance():
    """Monitor model performance in real-time"""

    # Create streaming query for real-time monitoring
    performance_stream = (
        spark
        .readStream
        .format("delta")
        .table("production.monitoring.prediction_logs")
        .withWatermark("timestamp", "1 hour")
        .groupBy(
            F.window("timestamp", "1 hour"),
            "model_version"
        )
        .agg(
            F.avg("accuracy").alias("avg_accuracy"),
            F.count("*").alias("prediction_count")
        )
        .writeStream
        .foreachBatch(check_performance_thresholds)
        .outputMode("update")
        .start()
    )

    return performance_stream

def check_performance_thresholds(batch_df, batch_id):
    """Check if performance drops below thresholds"""

    for row in batch_df.collect():
        if row.avg_accuracy < 0.85:
            send_alert(
                f"Model performance degraded: {row.avg_accuracy:.3f} < 0.85",
                severity="high",
                model_version=row.model_version
            )

            # Automatically trigger retraining
            trigger_retraining_pipeline(row.model_version)
Problem: Models work in development but fail in production due to environment differences.
Solution: Use containerization and infrastructure as code:
# Dockerfile for consistent environments
dockerfile_content = """
FROM databricks/minimal-runtime:latest
# Install specific package versions
COPY requirements.txt .
RUN pip install --no-cache-dir -r requirements.txt
# Copy model artifacts
COPY model/ /opt/ml/model/
# Set environment variables
ENV MLFLOW_TRACKING_URI="databricks"
ENV MODEL_NAME="production.ml_models.customer_churn_classifier"
# Health check endpoint
HEALTHCHECK --interval=30s --timeout=30s --start-period=5s --retries=3 \
 CMD curl -f http://localhost:8080/health || exit 1
"""

# requirements.txt with pinned versions
requirements = """
mlflow==2.8.1
databricks-cli==0.18.0
scikit-learn==1.3.0
pandas==2.0.3
numpy==1.24.3
"""
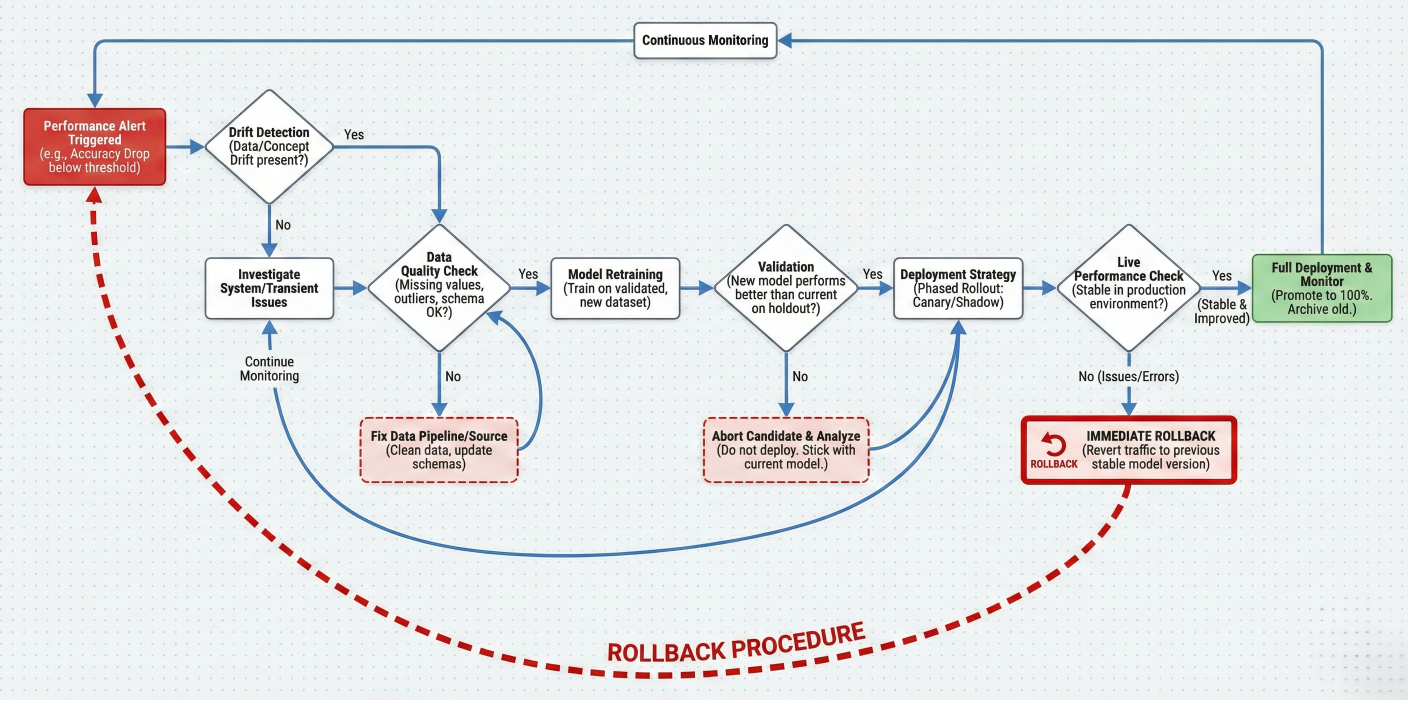
Troubleshooting flowchart showing: Performance alert → Drift detection → Data quality check → Model retraining → Validation → Deployment. Include decision points and rollback procedures.
Ready to build your first production-ready MLOps pipeline on Databricks? Here's a step-by-step implementation:
# Initialize your MLOps workspace
def setup_mlops_environment():
    """Set up Unity Catalog and initial schemas"""

    # Create catalog structure
    spark.sql("CREATE CATALOG IF NOT EXISTS production")
    spark.sql("CREATE SCHEMA IF NOT EXISTS production.raw_data")
    spark.sql("CREATE SCHEMA IF NOT EXISTS production.features")
    spark.sql("CREATE SCHEMA IF NOT EXISTS production.ml_models")
    spark.sql("CREATE SCHEMA IF NOT EXISTS production.monitoring")

    print("MLOps environment setup complete")

setup_mlops_environment()
# Feature engineering pipeline
def create_customer_features():
    """End-to-end feature pipeline"""

    # Read raw data
    transactions = spark.table("production.raw_data.transactions")
    customers = spark.table("production.raw_data.customers")

    # Engineer features
    customer_features = (
        transactions
        .groupBy("customer_id")
        .agg(
            F.sum("amount").alias("total_spent"),
            F.count("*").alias("transaction_count"),
            F.avg("amount").alias("avg_transaction"),
            F.max("transaction_date").alias("last_transaction_date")
        )
        .join(customers, "customer_id")
        .withColumn(
            "days_since_last_transaction",
            F.datediff(F.current_date(), F.col("last_transaction_date"))
        )
        .withColumn("feature_timestamp", F.current_timestamp())
    )

    # Write to Feature Store
    fs = FeatureStoreClient()
    fs.write_table(
        name="production.features.customer_features",
        df=customer_features,
        mode="overwrite"
    )

    print("Feature pipeline completed successfully")

# Schedule feature pipeline
create_customer_features()
def train_production_model():
    """Train and register production-ready model"""

    # Load training data with features
    fs = FeatureStoreClient()
    training_set = fs.create_training_set(
        df=spark.table("production.raw_data.labels"),
        feature_lookups=[
            fs.FeatureLookup(
                table_name="production.features.customer_features",
                lookup_key="customer_id"
            )
        ],
        label="churn"
    )

    training_df = training_set.load_df()

    # Convert to pandas for sklearn
    pdf = training_df.toPandas()

    # Prepare features and target
    feature_cols = ["total_spent", "transaction_count", "avg_transaction", "days_since_last_transaction"]
    X = pdf[feature_cols]
    y = pdf["churn"]

    # Split data
    from sklearn.model_selection import train_test_split
    X_train, X_test, y_train, y_test = train_test_split(X, y, test_size=0.2, random_state=42)

    # Train with MLflow tracking
    with mlflow.start_run() as run:
        # Train model
        rf = RandomForestClassifier(n_estimators=100, random_state=42)
        rf.fit(X_train, y_train)

        # Evaluate
        predictions = rf.predict(X_test)
        accuracy = accuracy_score(y_test, predictions)
        f1 = f1_score(y_test, predictions)

        # Log everything
        mlflow.log_param("n_estimators", 100)
        mlflow.log_metric("accuracy", accuracy)
        mlflow.log_metric("f1_score", f1)

        # Log model with feature store
        fs.log_model(
            model=rf,
            artifact_path="model",
            flavor=mlflow.sklearn,
            training_set=training_set,
            registered_model_name="production.ml_models.customer_churn_classifier"
        )

    print(f"Model trained successfully - Accuracy: {accuracy:.3f}")

train_production_model()
# Deploy model to production endpoint
def deploy_to_production():
    """Deploy model with monitoring"""

    # Create serving endpoint
    client = ModelServingClient()

    endpoint_config = {
        "name": "customer-churn-production",
        "config": {
            "served_models": [{
                "model_name": "production.ml_models.customer_churn_classifier",
                "model_version": "1",
                "workload_size": "Small",
                "scale_to_zero_enabled": True
            }]
        }
    }

    client.create_serving_endpoint(endpoint_config)

    # Set up monitoring
    enable_endpoint_monitoring("customer-churn-production")

    print("Model deployed successfully to production!")


def enable_endpoint_monitoring(endpoint_name):
    """Enable comprehensive monitoring"""

    # Create monitoring table
    spark.sql(f"""
    CREATE TABLE IF NOT EXISTS production.monitoring.{endpoint_name}_logs (
        request_id STRING,
        timestamp TIMESTAMP,
        model_version STRING,
        input_data STRING,
        prediction DOUBLE,
        response_time_ms INT,
        status_code INT
    ) USING DELTA
    """)

    print(f"Monitoring enabled for {endpoint_name}")


deploy_to_production()
Databricks transforms MLOps from a complex, tool-stitching nightmare into a streamlined, unified experience. By leveraging Unity Catalog for governance, MLflow for lifecycle management, and automated deployment pipelines, you can build reliable ML systems that actually deliver business value.
The key advantages you get with Databricks MLOps include:
Whether you're just starting your MLOps journey or looking to mature your existing practices, Databricks provides the foundation for scalable, reliable machine learning operations
Ready to take the next step? Start with a simple use case, implement the patterns we've covered, and gradually expand your MLOps capabilities. The investment in proper MLOps practices will pay dividends as your ML initiatives scale and mature.
Consider enrolling in Databricks' Advanced Machine Learning Operations course to deepen your skills and learn advanced patterns from the experts who built the platform.

{{AUTHOR}}
 Launch your Graphy