There are no items in your cart
Add More
Add More
| Item Details | Price | ||
|---|---|---|---|

In the fast-paced world of MLOps, deploying a machine learning (ML) model is truly just the beginning. Unlike traditional software, ML models don't just "break" with a clear error message. Instead, they can quietly degrade over time due to shifts in the data they encounter or changes in the underlying relationships they're trying to predict. This phenomenon is often referred to as a "silent failure," where a model continues to produce predictions, but their quality has deteriorated significantly, leading to potentially substantial negative impacts on business outcomes. Imagine a fraud detection model that suddenly misses more fraudulent transactions, or a recommendation engine that starts suggesting irrelevant products – these are the kinds of hidden problems that robust monitoring aims to prevent.
Evidently AI steps in as a powerful, open-source Python library designed specifically for evaluating, testing, and monitoring ML and even Large Language Model (LLM) systems. It's a fantastic tool for data scientists and ML engineers who need to keep a close eye on their models without getting bogged down in complex infrastructure setup. Its open-source nature, under the Apache 2.0 license, makes it not only cost-effective but also highly customizable, perfect for teams with varying resource constraints. This accessibility means that even smaller teams or individual practitioners can adopt sophisticated monitoring practices, leading to more reliable ML systems across the board, not just in large enterprises. It effectively democratizes best practices in MLOps, fostering wider adoption of essential principles for maintaining model health.
Evidently AI is your go-to open-source Python library for understanding what's truly happening with your ML models once they're in production. It helps you evaluate, test, and monitor your systems, specializing in detecting various forms of "drift" and tracking overall model performance.
This library is packed with over 100 built-in metrics and generates intuitive, interactive dashboards and reports. You can view these directly in your Jupyter notebooks, save them as standalone HTML files, or even integrate them seamlessly into Streamlit applications. This user-friendly approach makes it perfect for intermediate learners who want to quickly gain deep insights without a steep learning curve. The interactive nature of these dashboards is particularly valuable; it's not just about pretty visuals, but about enabling data scientists to effectively debug models. The ability to drill down into specific features or time periods allows for quickly pinpointing the root cause of performance degradation or drift, transforming Evidently from merely a monitoring tool into a powerful diagnostic aid.
Evidently supports tabular, text, and even multi-modal data, making it incredibly versatile for different ML applications. The open-source availability of Evidently AI means more than just cost savings. It implies a high degree of modularity and customization. Teams aren't locked into a vendor's specific feature set; instead, they can extend or modify Evidently to fit their unique needs. Furthermore, open-source projects often benefit from a vibrant community, which typically leads to faster bug fixes, the development of new features, and the sharing of valuable knowledge. This community aspect is a significant long-term benefit for users, fostering continuous improvement and support.
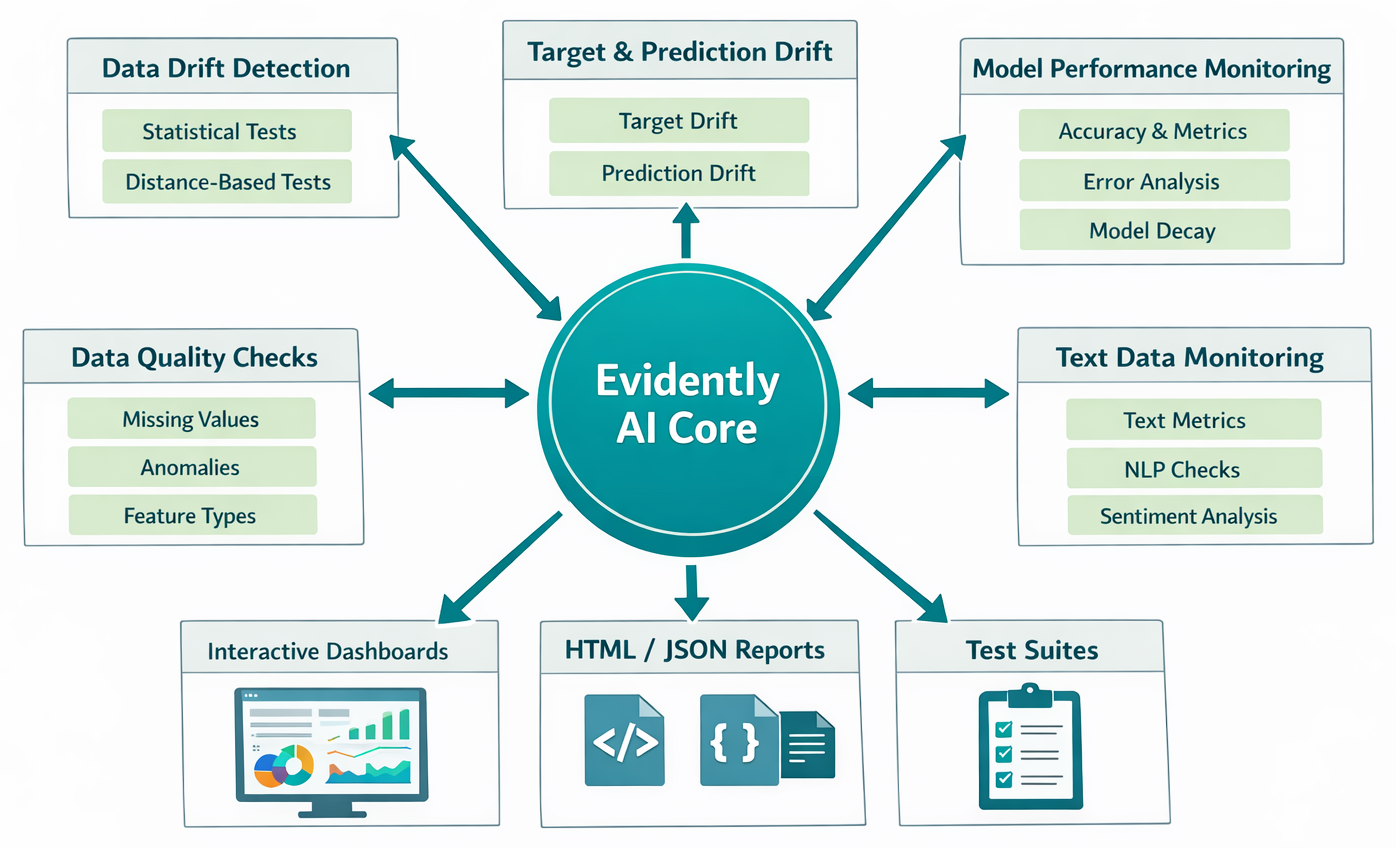
Diagram: Evidently AI's core functionalities (Data, Target, Prediction Drift, Model Performance, Data Quality).
Let's explore the core capabilities that make Evidently AI such a valuable asset in your MLOps toolkit.
Data drift occurs when the statistical properties of the input data change over time. Imagine your model was trained on data from last year, but now customer behavior or external factors (like a pandemic or a significant economic shift) have drastically altered the incoming data. This "drift" can make your model's predictions less reliable, even if the model itself hasn't changed. Evidently helps you catch these shifts early, allowing you to react before they significantly impact your model's performance.
Evidently employs a variety of robust statistical tests to detect data drift. For numerical features, it uses tests like the Kolmogorov-Smirnov (K-S) test and Wasserstein distance. For categorical features, you'll find Chi-Squared tests, Population Stability Index (PSI), and Jensen-Shannon divergence. It also supports rule-based tests for specific scenarios, such as detecting when new categorical values are added to the dataset, and allows for the inclusion of custom metrics tailored to your specific needs. The tool calculates a "drift score" which, for statistical tests, is often based on the p-value, and for distance-based tests, on distance or divergence measures.
It's important to understand that detecting data drift doesn't always necessitate immediate model retraining. The first step should always be to investigate data quality and external factors like seasonal spikes or natural calamities. If no external factors are present, you should check data processing steps and consult domain experts to identify the reason for the drift. Retraining the model should be a cautious decision, as new data might be insufficient or corrupted. This highlights a critical nuance for intermediate learners: a common pitfall is to react to every alert. Evidently' s comprehensive reports provide the necessary data to make an informed decision, prompting you to consider deeper questions such as whether the drift is truly significant, if it's impacting performance, or if it's due to a temporary external factor. This elevates monitoring from a simple alert system to a sophisticated decision-support system. Furthermore, the recommendation to consult "domain experts" when data drift is detected underscores that ML monitoring isn't purely a technical task. The raw statistical output from Evidently needs to be interpreted within the broader business context. A drift in a feature might be a normal occurrence, such as seasonality, or it could signal a critical shift requiring intervention. This emphasizes the interdisciplinary nature of MLOps and the necessity of collaboration between data scientists, engineers, and business stakeholders.
Let's see how easy it is to generate a data drift report. You'll typically need a reference dataset (your training data or a past stable period) and a production dataset (your current live data).
!pip install evidently
import pandas as pd
from evidently.report import Report
from evidently.metric_preset import DataDriftPreset
from evidently.pipeline.column_mapping import ColumnMapping
from sklearn import datasets # For a toy dataset

# Load a toy dataset (e.g., Adult dataset)
# You can replace this with your own reference and production dataframes
adult_data = datasets.fetch_openml(name="adult", version=2, as_frame="auto")
adult = adult_data.frame

# Introduce artificial drift for demonstration [4]
adult_ref = adult)]
adult_prod = adult)]

# Define column mapping [4, 5, 6]
column_mapping = ColumnMapping(
    numerical_features=["education-num", "age", "capital-gain", "hours-per-week", "capital-loss", "fnlwgt"],
    categorical_features=["education", "occupation", "native-country", "workclass", "marital-status", "relationship", "race", "sex", "class"]
)

# Create a Data Drift Report [3, 4, 5, 7]
data_drift_report = Report(metrics=)

# Calculate drift between reference and production data
data_drift_report.run(reference_data=adult_ref, current_data=adult_prod, column_mapping=column_mapping)

# Show the report directly in a notebook [4, 5]
data_drift_report.show()

# Or save it as an HTML file [3, 4, 5, 7]
data_drift_report.save_html("adult_data_drift_report.html")
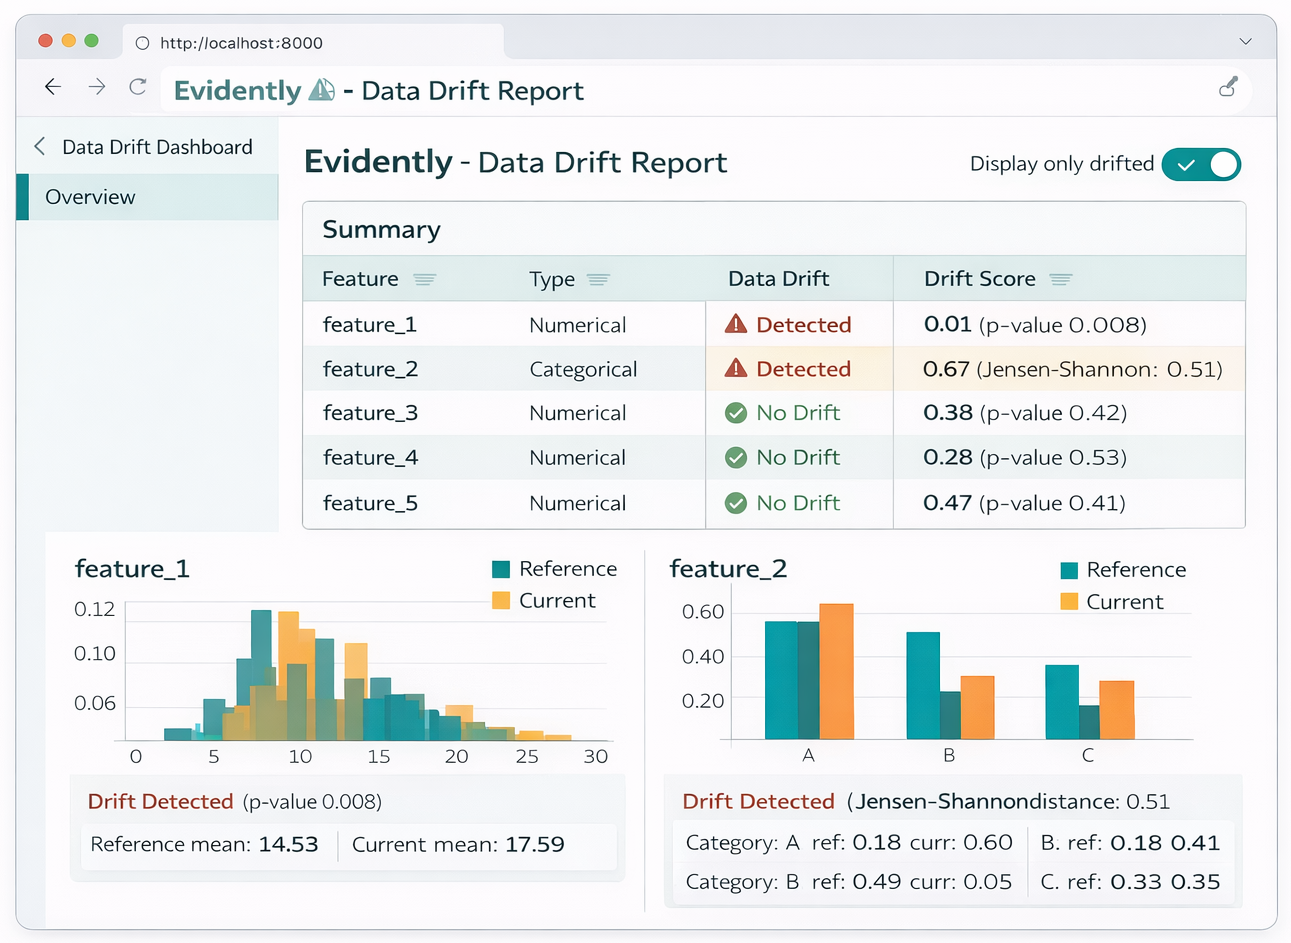
Diagram: Example Data Drift Report visualization.
Beyond monitoring input data, it's equally crucial to keep a close watch on your model's outputs. Target drift refers to changes in the distribution of the actual target variable (the ground truth), while prediction drift refers to changes in the distribution of your model's predictions.
Detecting these types of drift can serve as an early warning sign of model decay, even before you receive the actual ground truth labels. This is a common and significant challenge in many real-world ML applications where ground truth labels are delayed, such as in fraud detection or loan approval systems. Evidently's ability to monitor prediction drift helps you debug potential issues when immediate ground truth isn't available, providing valuable insights into how your model's behavior might be shifting. The
NumTargetDriftTab and TargetDriftTab are specifically designed within Evidently for this purpose. This capability is a significant advantage, as relying solely on model performance metrics that require ground truth would mean reacting to problems too late. Prediction drift monitoring allows for proactive identification of potential issues, enabling earlier intervention and reducing negative business impact. This shifts the focus of monitoring from reactive to predictive.
It's also worth noting the interplay between data drift and prediction drift. If data drift is detected without a corresponding prediction drift, retraining might not be necessary, suggesting the model is robust to those input changes. However, if data drift is found alongside prediction drift, and the results indicate a negative impact, then retraining should be seriously considered. This implies a hierarchical monitoring strategy where data drift alerts might prompt a closer look at prediction drift, and only a combination of both (especially negative prediction drift) truly necessitates retraining.
The adage "garbage in, garbage out" is a golden rule in machine learning, and it couldn't be more true for data quality. Data quality issues are a primary cause of model degradation in production. These problems can stem from various sources, including using the wrong data source, losing access to necessary data, broken SQL queries, infrastructure updates, or even faulty feature engineering code that introduces errors at a corner case.
Evidently helps you catch a wide array of these issues, such as schema changes, an unexpected number of missing values, duplicate columns or rows, features that become constant (or almost constant), highly correlated features that might indicate redundancy, target leaks, and range violations (e.g., negative age or sales figures). Evidently' s
DataQualityTab provides a comprehensive overview of your features, offering detailed statistics for both numerical and categorical data.[3] You can inspect key descriptive statistics like minimum and maximum values, quantiles, unique values, most common values, and the share of missing values.
You can compare current data against a reference dataset to automatically generate test conditions, or if no reference is available, you can set manual thresholds based on your domain knowledge. Proactively monitoring data quality with Evidently can prevent many downstream problems, making it a foundational layer of ML observability rather than just a reactive measure. This is because poor data quality often precedes or directly causes data drift and subsequent model performance degradation. The flexibility to allow manual thresholds or auto-generated tests based on a reference demonstrates Evidently's adaptability to diverse operational environments, making it a practical tool for a wider range of MLOps setups, especially when a perfect "golden" reference dataset might not exist or be impractical to maintain.
Let's build on our previous example and generate a data quality report.
from evidently.report import Report
from evidently.metric_preset import DataQualityPreset, DataSummaryPreset # DataSummaryPreset is also for quality checks
from evidently.pipeline.column_mapping import ColumnMapping
import pandas as pd
from sklearn import datasets

# Load data (same as before)
adult_data = datasets.fetch_openml(name="adult", version=2, as_frame="auto")
adult = adult_data.frame
adult_ref = adult
adult_prod = adult

column_mapping = ColumnMapping(
    numerical_features=["education-num", "age", "capital-gain", "hours-per-week", "capital-loss", "fnlwgt"],
    categorical_features=["education", "occupation", "native-country", "workclass", "marital-status", "relationship", "race", "sex", "class"]
)

# Create a Data Quality Report (using DataQualityPreset or DataSummaryPreset)
data_quality_report = Report(metrics=[])  # Or DataSummaryPreset()

# Run the report
data_quality_report.run(current_data=adult_prod, column_mapping=column_mapping)

# Show or save the report
data_quality_report.show()
data_quality_report.save_html("adult_data_quality_report.html")
Ultimately, a model's value lies in its performance. Evidently helps you track key metrics like accuracy, precision, recall, F1-score, and AUC for classification models, and various error metrics (e.g., Mean Absolute Error, Root Mean Squared Error) for regression models. This helps you understand if your model is still meeting its objectives and delivering the expected business value.
Evidently provides specialized tabs for different model types: ClassificationPerformanceTab, ProbClassificationPerformanceTab (for models with probabilistic outputs), and RegressionPerformanceTab. These reports offer extensive information, including different error metrics, distributions, and insights into under- or overestimated predictions, comparing reference and production datasets. The true value here lies in comparing reference performance with production performance. A drop in accuracy from 95% to 90% might be acceptable in one context but critical in another. Evidently's reports facilitate this comparison, allowing users to contextualize performance degradation against a known baseline, which is crucial for informed decision-making about retraining or intervention. This moves beyond raw numbers to actionable understandings.
It's important to acknowledge that while Evidently offers comprehensive performance reports, these typically require ground truth labels. This creates a dependency: if ground truth is significantly delayed, performance monitoring becomes a lagging indicator. This reinforces the earlier point about prediction drift monitoring serving as a leading indicator in such scenarios. A comprehensive monitoring strategy often needs both: prediction drift for early warnings and performance monitoring for definitive validation once ground truth becomes available.
Let's look at an example of generating a model performance report for a classification task.
from evidently.report import Report
from evidently.metric_preset import ClassificationPreset, RegressionPreset
from evidently.pipeline.column_mapping import ColumnMapping
import pandas as pd
from sklearn import datasets
from sklearn.model_selection import train_test_split
from sklearn.ensemble import RandomForestClassifier
from sklearn.metrics import accuracy_score

# Load a dataset and train a simple model for demonstration
iris_data = datasets.load_iris(as_frame=True)
iris_frame = iris_data.frame
iris_frame.rename(columns={'target': 'prediction_target'}, inplace=True) # Rename target to avoid conflict with 'target' in ColumnMapping

# Simulate reference data (training set)
X_train, X_test, y_train, y_test = train_test_split(
    iris_frame.drop('prediction_target', axis=1),
    iris_frame['prediction_target'],
    test_size=0.3,
    random_state=42
)
model = RandomForestClassifier(random_state=42).fit(X_train, y_train)
y_train_pred = model.predict(X_train)
y_test_pred = model.predict(X_test)

# Combine data for Evidently
reference_data = X_train.copy()
reference_data['target'] = y_train
reference_data['prediction'] = y_train_pred

production_data = X_test.copy()
production_data['target'] = y_test
production_data['prediction'] = y_test_pred

# Define column mapping for Evidently
column_mapping = ColumnMapping(
    target='target',
    prediction='prediction',
    numerical_features=['sepal length (cm)', 'sepal width (cm)', 'petal length (cm)', 'petal width (cm)']
)

# Create a Classification Performance Report
classification_performance_report = Report(metrics=[ClassificationPreset()])

# Run the report
classification_performance_report.run(
    reference_data=reference_data,
    current_data=production_data,
    column_mapping=column_mapping
)

# Show or save the report
classification_performance_report.show()
classification_performance_report.save_html("iris_classification_performance_report.html")

# For Regression, you'd use RegressionPreset() similarly
# regression_performance_report = Report(metrics=[RegressionPreset()])
# regression_performance_report.run(reference_data=ref_df, current_data=prod_df, column_mapping=column_mapping)
Evidently isn't just for tabular data! It offers specialized support for raw text data, including embedding drift detection and text-specific metrics like sentiment, text length, and regex matches. This is particularly valuable for Natural Language Processing (NLP) models and Large Language Model (LLM) systems, which are increasingly common in today's AI landscape. The explicit mention of "text data monitoring" and "LLM systems" signifies a broader trend in ML. As AI moves beyond traditional tabular models into more complex domains like NLP and Generative AI, monitoring tools must adapt. Evidently's support for text data demonstrates its forward-thinking design, addressing the growing need to monitor unstructured data, which presents unique challenges compared to structured data.
For more automated and robust MLOps, Evidently allows you to convert its detailed reports into pass/fail test suites. This means you can define specific conditions (e.g., "no more than 5% missing values," "no significant data drift in critical features") and integrate these tests directly into your Continuous Integration/Continuous Deployment (CI/CD) pipelines. If a test fails, it can trigger an alert or even prevent a problematic model from being deployed or a new data batch from being processed. This capability is crucial for regression testing and ensuring continuous quality throughout the ML lifecycle. The ability to convert reports into "pass/fail test suites" for CI/CD is a direct application of MLOps principles. It transforms monitoring from a manual inspection process into an automated quality gate. This reduces human error, ensures consistent quality checks, and enables faster, safer deployments, highlighting the shift from reactive debugging to proactive prevention of issues in the ML lifecycle.
Evidently is designed to integrate seamlessly with various MLOps tools, making it a flexible component of your existing stack. Let's explore some common integration patterns that can help you build a comprehensive monitoring solution.
When serving your ML model with a web framework like FastAPI, you need a way to capture prediction data for monitoring without impacting the latency of your API. FastAPI's BackgroundTasks are perfect for this scenario. You can log input features and model outputs to a database (like BigQuery in the example) as a background task, ensuring your prediction endpoint remains fast and responsive. This architectural choice directly addresses the performance concern, as Evidently itself might be less suited for high-throughput, real-time
inference-time monitoring. This integration pattern demonstrates how you can collect data for
near-real-time or batch monitoring without compromising the core model serving latency, highlighting a common architectural approach in MLOps for balancing performance and observability.
Later, you can retrieve this logged data (e.g., the last N predictions) and your reference data to generate Evidently reports on demand. The FastAPI example shows loading "last predictions" from a database, which implies a need for a robust data logging and aggregation strategy, perhaps using tools like BigQuery or PostgreSQL. Evidently consumes pandas DataFrames, so the raw logged predictions often need to be transformed and potentially joined with ground truth (if available) before generating reports. This points to the often-underestimated data engineering effort required for effective ML monitoring, even when using user-friendly tools like Evidently.
Here's a simplified example showing how to set up an endpoint that triggers Evidently report generation and serves it.
# Simplified app.py (main FastAPI application file)
from fastapi import FastAPI, BackgroundTasks, FileResponse
import joblib
import pandas as pd
import logging
from datetime import datetime

# Evidently imports
from evidently.report import Report
from evidently.metric_preset import DataDriftPreset
from evidently.pipeline.column_mapping import ColumnMapping

# Assume these are defined elsewhere or loaded
# For demonstration, let's create dummy data and a dummy model
# In a real scenario, you'd load your actual model and data
app = FastAPI()
# Dummy model for example
class DummyModel:
    def predict(self, df):
        # Simple dummy prediction
        return  * len(df)
model = DummyModel() # Replace with joblib.load("model.joblib")

# --- Dummy Data & Model Setup for example ---
# Reference data (e.g., training data)
reference_df = pd.DataFrame({
    'feature_1': ,
    'feature_2': ,
    'target': ,
    'prediction':  # Example predictions for reference
})
# In a real app, this would be loaded from a persistent store
# For simplicity, we'll store recent predictions in a list
prediction_logs =
DATA_WINDOW_SIZE = 100 # How many predictions to keep for current data

# Define column mapping for Evidently
column_mapping = ColumnMapping(
    target='target',
    prediction='prediction',
    numerical_features=['feature_1', 'feature_2']
)
# --- End Dummy Setup ---

# Function to simulate saving predictions
def save_prediction_log(input_data: dict, prediction_result: int):
    log_entry = {
        "created_at": datetime.now(),
        "input": input_data,
        "output": prediction_result
    }
    prediction_logs.append(log_entry)
    logging.info(f"Logged prediction: {log_entry}")
    if len(prediction_logs) > DATA_WINDOW_SIZE:
        prediction_logs.pop(0)

# Endpoint for model prediction
@app.post("/predict/")
async def predict(features: dict, background_tasks: BackgroundTasks):
    prediction = model.predict(pd.DataFrame([features]))
    background_tasks.add_task(save_prediction_log, input_data=features, prediction_result=prediction)
    return {"prediction": prediction}

# Function to generate and save the Evidently dashboard
def generate_evidently_dashboard_html() -> str:
    dashboard_path = "static/evidently_dashboard.html"
    current_df_raw = pd.DataFrame(prediction_logs)

    if current_df_raw.empty:
        logging.warning("No current prediction data to generate report.")
        return "No data for report."

    current_features = pd.json_normalize(current_df_raw['input'])
    current_predictions = current_df_raw['output'].rename('prediction').to_frame()

    current_data = pd.concat([current_features, current_predictions], axis=1)
    current_data['target'] = reference_df['target'].sample(len(current_data), replace=True).reset_index(drop=True)

    data_drift_report = Report(metrics=)
    data_drift_report.run(reference_data=reference_df, current_data=current_data, column_mapping=column_mapping)
    data_drift_report.save_html(dashboard_path)

    logging.info(f"Evidently dashboard saved to {dashboard_path}")
    return dashboard_path

# Endpoint to view the monitoring dashboard
@app.get("/monitoring")
async def get_monitoring_dashboard():
    dashboard_location = generate_evidently_dashboard_html()
    if dashboard_location == "No data for report.":
        return {"message": dashboard_location}
    return FileResponse(dashboard_location)
# To run this:
# 1. Save as app.py
# 2. Create a 'static' directory in the same folder
# 3. If using a real model:
# import joblib # from sklearn.ensemble import RandomForestClassifier
# import pandas as pd
# model = RandomForestClassifier()
# dummy_df = pd.DataFrame({'feature_1': , 'feature_2': , 'target': })
# model.fit(dummy_df[['feature_1', 'feature_2']], dummy_df['target'])
# joblib.dump(model, 'model.joblib')
# Save your trained model
# 4. Run: uvicorn app:app --reload
# 5. Send POST requests to /predict/ and then visit /monitoring
MLflow is a popular platform for managing the ML lifecycle, including experiment tracking, model registry, and deployment. You can use Evidently to calculate data drift and other monitoring metrics, and then log these results directly into MLflow Tracking. This allows you to associate monitoring results with specific model versions or experiments, providing a holistic view of your model's performance and stability over its entire lifecycle.
You can log parameters, such as the begin and end dates of a data batch, and metrics, like drift scores for individual features, directly into your MLflow runs. This creates a comprehensive record that can be easily explored and visualized using the MLflow UI, making it simple to track how data characteristics change over time relative to different model iterations.
Here's how you can log Evidently drift reports to MLflow.
import mlflow
import mlflow.sklearn # For logging models if needed
import pandas as pd
from evidently.report import Report
from evidently.metric_preset import DataDriftPreset
from evidently.pipeline.column_mapping import ColumnMapping
from mlflow.tracking import MlflowClient
import warnings
warnings.filterwarnings('ignore') # Suppress warnings for cleaner output

# --- Dummy Data Setup [6] ---
# Load or create reference and production data
# For demonstration, let's use a simplified version of the bike-sharing dataset concept
# In a real scenario, you'd load your actual dataframes
data = {
    'dteday': pd.to_datetime(['2011-01-01', '2011-01-02', '2011-01-03', '2011-02-01', '2011-02-02', '2011-02-03']),
    'weathersit': ,
    'temp': [0.24, 0.22, 0.24, 0.35, 0.38, 0.36],
    'hum': [0.81, 0.80, 0.75, 0.60, 0.55, 0.65],
    'windspeed': [0.0, 0.0, 0.0, 0.1, 0.12, 0.08],
    'holiday': ,
    'workingday':
}
raw_data = pd.DataFrame(data)

# Define column mapping for Evidently Profile
data_columns = ColumnMapping(
    datetime='dteday',
    numerical_features=['weathersit', 'temp', 'hum', 'windspeed'],
    categorical_features=['holiday', 'workingday']
)

# Set reference dates and experiment batches dates
reference_dates = ('2011-01-01 00:00:00', '2011-01-03 23:00:00')
experiment_batches =

# Function to evaluate data drift with Evidently Report
def eval_drift(reference_df, production_df, column_mapping):
    data_drift_report = Report(metrics=)
    data_drift_report.run(reference_data=reference_df, current_data=production_df, column_mapping=column_mapping)
    report_dict = data_drift_report.as_dict()
    drifts =
    # Extract drift scores for relevant features
    for metric in report_dict['metrics']:
        if metric['metric_name'] == 'DataDriftTable':
            for column_info in metric['result']['columns']:
                feature_name = column_info['column_name']
                # For simplicity, let's log the 'drift_score' if available or a boolean for 'drift_detected'
                if 'drift_score' in column_info:
                    drifts.append((feature_name, column_info['drift_score']))
                elif 'drift_detected' in column_info:
                    drifts.append((feature_name + '_drift_detected', int(column_info['drift_detected'])))
    return drifts

# Log into MLflow
client = MlflowClient()
mlflow.set_experiment('Data Drift Evaluation with Evidently')
for date_range in experiment_batches:
    with mlflow.start_run() as run:
        mlflow.log_param("begin_date", date_range)
        mlflow.log_param("end_date", date_range)
        current_data_batch = raw_data.loc[raw_data.dteday.between(date_range, date_range)]
        reference_data_batch = raw_data.loc[raw_data.dteday.between(reference_dates, reference_dates)]
        metrics = eval_drift(reference_data_batch, current_data_batch, column_mapping=data_columns)
        for feature_name, drift_value in metrics:
            mlflow.log_metric(feature_name, round(drift_value, 3))
        print(f"Logged run: {run.info.run_id} for dates {date_range}")

# To view results, run `mlflow ui` in your terminal from the directory where your MLflow runs are logged.
For a holistic view of your ML system, combining Evidently AI with Prometheus and Grafana creates a powerful monitoring stack. Prometheus is an open-source monitoring system that excels at collecting and storing time-series metrics from various targets via a pull model over HTTP. It's commonly used to monitor API response times, request counts, and resource usage (CPU, memory) of model containers. Grafana, on the other hand, is an open-source platform for visualization and observability. It integrates seamlessly with Prometheus and other data sources to display time-series metrics on interactive dashboards.
While Prometheus and Grafana provide excellent infrastructure and API-level monitoring, Evidently AI specializes in ML-specific insights: detecting data drift, target drift, and evaluating model performance and data quality. This complementary nature is key: Prometheus and Grafana handle the "system health" and "API performance," while Evidently focuses on the "ML model health." This approach allows for a comprehensive monitoring stack for holistic observability, ensuring that both the underlying infrastructure and the ML models themselves are continuously observed for issues.
Evidently generates its detailed reports in HTML or JSON formats. To integrate these insights into Grafana, you would typically need a mechanism to bridge Evidently's reports to Grafana. This might involve setting up custom exporters that parse Evidently's JSON output and expose it as Prometheus metrics, or developing custom Grafana plugins that can directly consume and visualize Evidently's HTML or JSON reports. While the research material suggests combining these tools, it doesn't provide direct code examples for Evidently's metrics being scraped by Prometheus or visualized directly in Grafana, indicating that this integration often requires an additional layer of custom scripting or specialized connectors. This highlights the integration layer challenge that can arise in heterogeneous MLOps stacks, where different specialized tools need to communicate effectively.
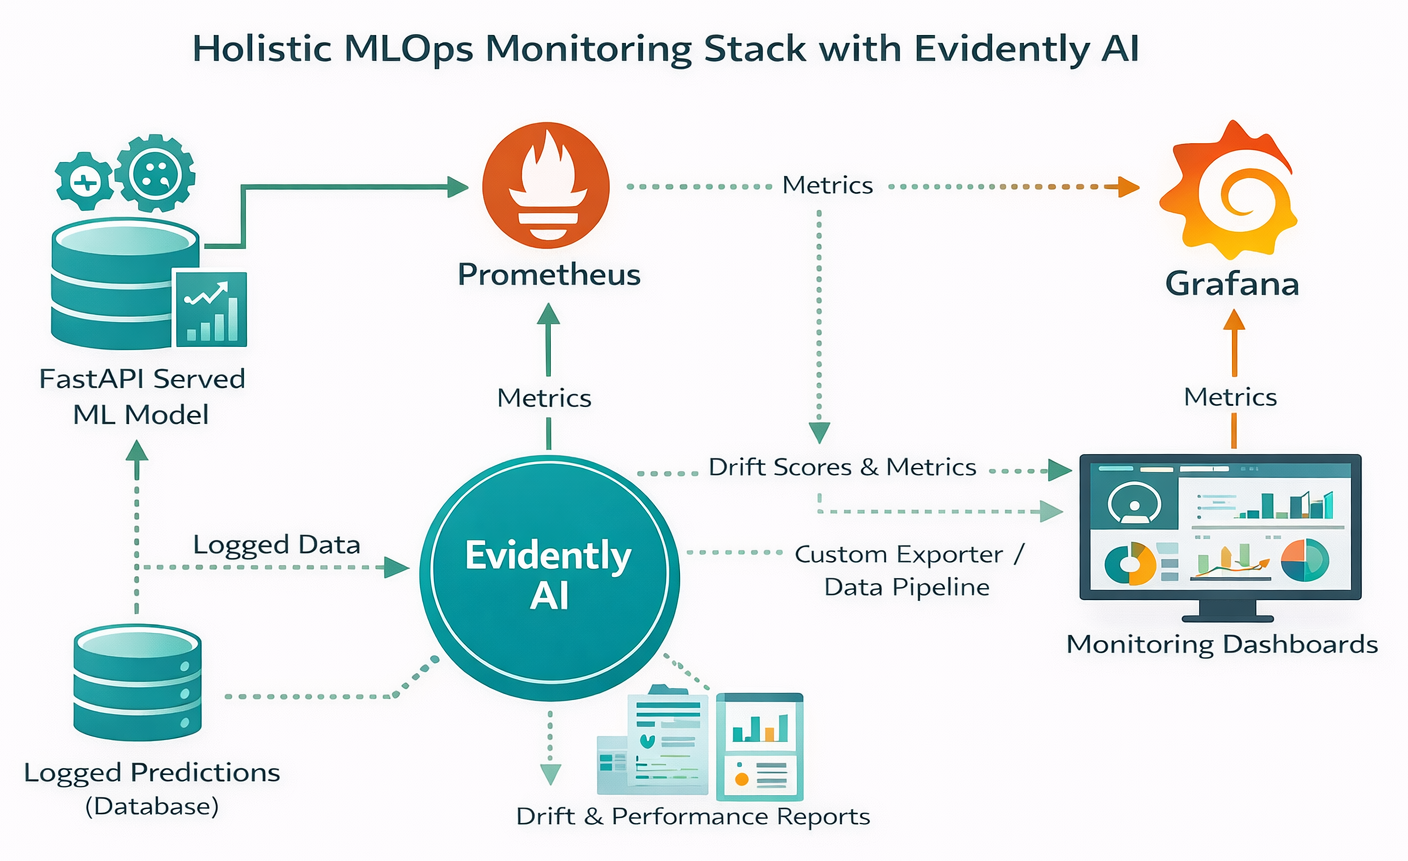
Diagram: Evidently AI integrated with Prometheus and Grafana for a holistic MLOps monitoring stack.
Streamlit is an open-source Python library that makes it incredibly easy to create interactive web applications directly from your Python scripts. This makes it an ideal companion for Evidently AI, allowing you to build custom, shareable, and interactive ML monitoring dashboards.
The core idea is to "embed" Evidently Reports as part of a Streamlit web application. Evidently already provides all the necessary building blocks, metrics, and visuals to design the components of an ML monitoring and data quality dashboard. You can generate these reports in a Jupyter notebook, run a Python script, or schedule the report generation process using a workflow manager like Airflow. Once generated, Evidently's HTML reports can be directly incorporated into a Streamlit app, making them accessible and interactive for a wider audience. This empowers non-technical stakeholders with accessible visualizations, allowing them to understand complex model behavior and data shifts without needing to delve into code or raw data. This bridge between technical analysis and business understanding is vital for effective MLOps.
To organize your monitoring dashboards effectively within Streamlit, you can structure your Evidently reports in different directories. For example, you might use monitoring period start and end dates as folder names (e.g., "2011-02-12_2011-02-18"). If you add sub-directories (e.g., "data_quality" and "model_performance"), these can appear as separate tabs in your Streamlit application, providing a clean and navigable interface. This emphasizes the importance of report organization for long-term monitoring, ensuring that historical data and different aspects of model health are easily retrievable and comparable.
Here's a conceptual code snippet illustrating how Evidently reports might be integrated into a Streamlit app:
# Conceptual Streamlit app.py
import streamlit as st
import pandas as pd
from evidently.report import Report
from evidently.metric_preset import DataDriftPreset, ClassificationPreset
from evidently.pipeline.column_mapping import ColumnMapping
import os

# Assume your Evidently HTML reports are saved in a 'reports' directory
# For example: reports/data_drift_report.html, reports/model_performance_report.html

st.set_page_config(layout="wide")
st.title("ML Model Monitoring Dashboard")

# Example: Load a dummy reference and current data for report generation
# In a real app, this would come from your data logging system
reference_df = pd.DataFrame({'feature_A': , 'feature_B': , 'target': , 'prediction': })
current_df = pd.DataFrame({'feature_A': [1.1,2.2,3.3,4.4,5.5], 'feature_B': [10.5,11.5,12.5,13.5,14.5], 'target': , 'prediction': })
column_mapping = ColumnMapping(target='target', prediction='prediction', numerical_features=)

# Generate reports on the fly or load pre-generated ones
def generate_and_save_reports():
    if not os.path.exists("reports"):
        os.makedirs("reports")

    # Data Drift Report
    data_drift_report = Report(metrics=)
    data_drift_report.run(reference_data=reference_df, current_data=current_df, column_mapping=column_mapping)
    data_drift_report.save_html("reports/data_drift_report.html")

    # Classification Performance Report
    classification_performance_report = Report(metrics=[ClassificationPreset()])
    classification_performance_report.run(reference_data=reference_df, current_data=current_df, column_mapping=column_mapping)
    classification_performance_report.save_html("reports/classification_performance_report.html")

# Run this function once to ensure reports exist for the demo
generate_and_save_reports()

# Create tabs for different reports
tab1, tab2 = st.tabs()

with tab1:
    st.header("Data Drift Overview")
    try:
        # Read the HTML content of the Evidently report
        with open("reports/data_drift_report.html", "r", encoding="utf-8") as f:
            html_content = f.read()
        # Embed the HTML content in Streamlit
        st.components.v1.html(html_content, height=800, scrolling=True)
    except FileNotFoundError:
        st.warning("Data Drift report not found. Please ensure it has been generated.")

with tab2:
    st.header("Model Performance Metrics")
    try:
        with open("reports/classification_performance_report.html", "r", encoding="utf-8") as f:
            html_content = f.read()
        st.components.v1.html(html_content, height=800, scrolling=True)
    except FileNotFoundError:
        st.warning("Model Performance report not found. Please ensure it has been generated.")

# To run this:
# 1. Save as app.py
# 2. Run: streamlit run app.py.
In summary, Evidently AI stands out as an incredibly versatile and powerful open-source library for ML model monitoring. It provides comprehensive capabilities for detecting critical issues like data drift, target drift, and prediction drift, while also offering robust tools for assessing data quality and tracking model performance over time. Its support for various data types, including tabular and text, makes it adaptable to a wide range of ML applications, including emerging LLM systems.
The ability to generate interactive HTML reports and convert them into automated test suites means Evidently can seamlessly integrate into your existing MLOps pipelines, whether you're serving models with FastAPI, tracking experiments with MLflow, or building interactive dashboards with Streamlit. This flexibility, combined with its open-source nature, makes it an accessible and cost-effective solution for teams of all sizes looking to enhance their ML observability.
By leveraging Evidently AI, you can move beyond reactive debugging to proactive problem prevention, ensuring your ML models remain robust, reliable, and continue to deliver business value long after deployment. It empowers data scientists and ML engineers to maintain the health of their models with confidence.

{{AUTHOR}}
 Launch your Graphy